Customer experience KPIs have never been easier to collect. AI-powered tools can now analyze every call, ticket and renewal conversation your team has. What they can't tell you is whether any of those customer interactions were worth having in the first place.
That gap between measuring an experience and improving it is where companies lose loyalty and revenue. It's also where the upside is. Watermark Consulting's Customer Experience ROI Study found that CX leaders generated a total return 7.8 times greater than CX laggards over nearly two decades and beat the S&P 500 by 415 points.
The brands that get this right track a small stack of customer experience KPIs, tie each one to a revenue outcome, give it a named owner and read it with the human judgment AI can't supply. Here's what belongs in that stack today.
What Are Customer Experience KPIs?
Customer experience KPIs are the metrics that show whether your organization keeps the promise your brand makes, measured through loyalty, effort, retention and revenue. The most common customer experience metrics are Net Promoter Score (NPS), Customer Satisfaction Score (CSAT), Customer Effort Score (CES), churn and retention rates, customer lifetime value (CLV) and customer service measures such as first response time and average resolution time.
For a revenue leader, the more useful split is between lagging and leading signals. Lagging KPIs report what customers already decided. Leading KPIs show behavior while there's still time to change the outcome.
Core Customer Experience KPIs
Why AI Makes Customer Experience KPIs More Important, Not Less
AI changes three things about measuring customer experience, and each one raises the stakes.
AI Multiplies Signals Without Adding Judgment
AI multiplies the number of signals a team can collect, but it doesn't decide which ones matter. A team that's already buried in NPS, customer satisfaction scores, ticket volume and customer sentiment data won't get clarity from a tool that triples that volume. It'll get the same unfocused measurement, faster, with better-looking charts.
AI Acts on CX Metrics in Real Time
AI is starting to act on these signals directly. It routes accounts and flags renewals in real time, often before a person checks the logic. A flawed KPI used to mislead one person reading a report. Now it can drive an automated decision at scale before anyone notices the number was wrong.
Customer Expectations Keep Rising
The bar for customer experience keeps rising. Buyers carry the expectations set by the most personalized experiences in their lives into every B2B interaction, and a measurement system built for last year's expectations is already behind.
Put those together and the teams that pull ahead will be the ones that pick a small number of signals connected to revenue and build the discipline to act on every one of them.
5 Customer Experience KPIs Every AI-Era Sales Leader Must Track
Every customer experience KPI below connects to a revenue decision, and none of them works alone. Drop one and you lose part of the picture.
Retention and Revenue Signals: GRR, NRR, Churn and Expansion
Net revenue retention (NRR) measures the recurring revenue you keep from existing customers, expansion included. Gross revenue retention (GRR) measures the same thing before expansion is added back, which isolates pure retention. Together they're the closest thing to an honest read on customer experience in a B2B business.
If NRR looks healthy while GRR is slipping, you've got a churn problem your upsells are covering up. Track both alongside churn and expansion revenue and you're measuring customer experience in the language your CFO already trusts. Revenue leaders should own this signal instead of handing it to a CX team without a seat at the table.
Loyalty and Advocacy Signals: NPS and Referral Behavior
Net Promoter Score (NPS) asks how likely a customer is to recommend you on a scale of 0 to 10, then subtracts the percentage of detractors from the percentage of promoters. It gets overused as a headline number, and scores drift from reality fast when survey timing is gamed or customers are coached toward a nine or a 10. Keep tracking it. Just stop leading with it.
Watch NPS as a trend line and check whether the trend converts into referral behavior: a customer who brings you the next customer. XM Institute's ROI of Customer Experience study found customers are 2.9 times more likely to trust a brand after a five-star experience than after a one- or two-star one. A referral is that trust put on the line, with the customer staking their own credibility on you.
Experience-Friction Signals: CES, Sentiment and Recurring Pain Points
Customer Effort Score (CES) measures how easy it was for a customer to get what they came for. Research published in Harvard Business Review's "Stop Trying to Delight Your Customers," based on a study of more than 75,000 people, found CES is a better predictor of loyalty than satisfaction measures or NPS. Pair it with customer sentiment analysis and a running log of recurring pain points, the same friction showing up call after call and quarter after quarter.
Customers rarely leave because of one bad experience. They leave because friction piled up: an extra step here, a delay there, one more moment of working harder than they expected. A customer-centric mindset starts with clearing the obstacles between your customer and their outcome, and CES paired with honest pain-point tracking tells you whether that's happening.
Customer-Behavior Signals: Adoption, Engagement and Journey Completion
Adoption, engagement and journey-completion data show whether customers use what they bought, and usage says more about renewal than any sentiment score. Compare each account's behavior with your best, stickiest accounts. The accounts that stall between onboarding and expansion rarely tell you why.
Many CX dashboards skip this category. A health score built only from logins, ticket volume and NPS is watching the aftermath. Behavior data benchmarked against your best accounts shows you what's happening while there's still time to change it.
Action Signals: Closed-Loop Follow-Through and Behavior Change
Closed-loop rate measures how fast your team follows up with a customer who flagged a problem and whether that problem gets resolved. It's the one KPI that separates companies that collect customer feedback from companies that act on it.
A low closed-loop rate means feedback is piling up unused and nobody's resolving issues, and in B2B that's where accounts quietly decide not to renew. Nobody sends an angry email first. They stop responding to your outreach, and by the time it shows up in your churn numbers, the decision was made months earlier.
What Customer Experience Data Alone Can't Tell You
AI can tell you what happened. It can't tell you what it means or what to do next.
Harvard Business School professor Gerald Zaltman found that 95 percent of purchase decision-making takes place in the subconscious mind. People bring their memories, experiences and preconceived notions into every interaction. That holds for the customer decision-making process on the way into a deal and for the renewal decision on the way out. Data captures the surface of it.
The customer health score, used the way most companies use it, doesn't hold up against that reality. It gets sold as an early-warning system. In practice it's usually a lagging scorecard confirming what you already suspected, right after it's too late to act cleanly. Green accounts churn. Red accounts renew. The score described the past without changing a single decision.
The numbers need a person reading them. Customer sentiment data can show you how customers perceive an interaction, but it can't tell you why a renewal went sideways or what would win the account back. That answer usually comes from a conversation, and it takes a leader who knows the account well enough to turn a signal into actionable insights.
How to Build a Customer Experience Measurement System Your Team Will Use
A measurement system matters only if it changes behavior. Four habits separate the companies that use customer experience KPIs to build momentum from the ones that fill out a report.
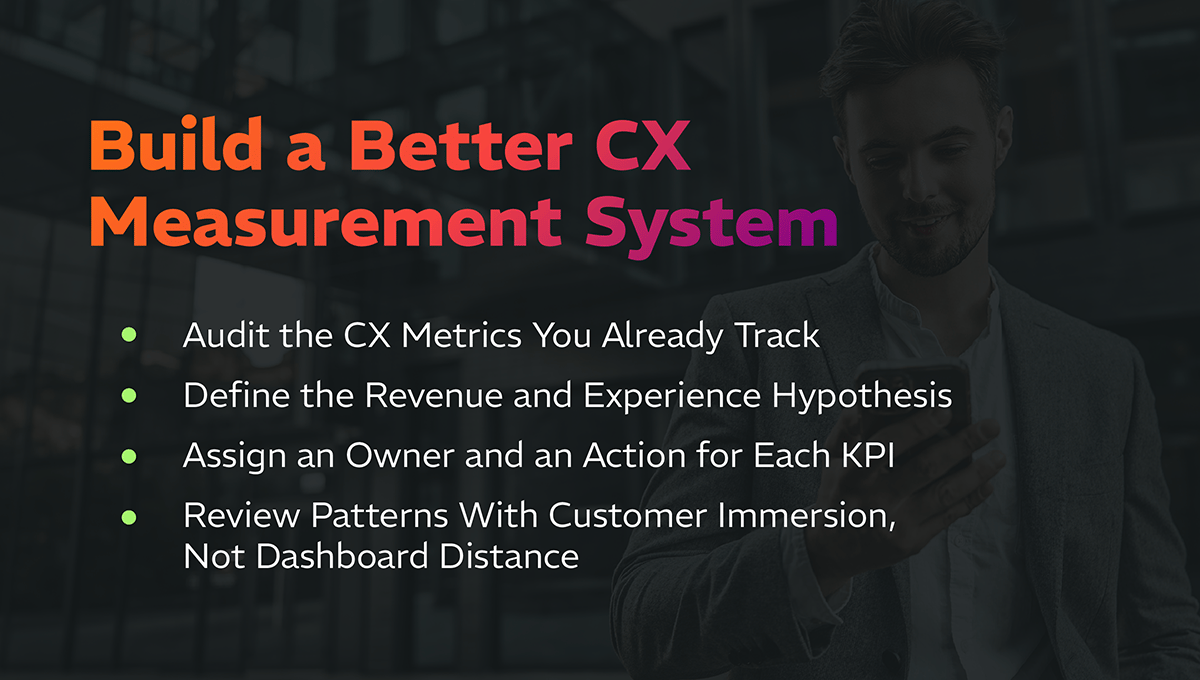
Audit the CX Metrics You Already Track
Start with the dashboard you have. Sort every metric into the lagging and leading columns from the table above, then cut anything that doesn't have an owner or a clear reason to exist. Most teams find they're long on lagging scores and short on the leading signals, usually effort, adoption and closed-loop rate, that give them time to act.
Define the Revenue and Experience Hypothesis
Before a number earns a spot on your dashboard, name what you expect it to prove. If CES improves this quarter, what should happen to expansion revenue over the next two? If closed-loop rate improves, what should happen to churn six months out? I've written about this discipline in my own business: you can't improve what you don't measure. The rule holds at the enterprise level too. A KPI without a stated hypothesis is a number waiting for someone to ask what it means, and usually nobody does.
Assign an Owner and an Action for Each KPI
Shared ownership is no ownership. When NPS drops, decide in advance who makes the call. When CES flags friction in onboarding, one leader should have the authority to fix it without convening a committee. Settle those questions before the number moves, or your CX metrics will produce plenty of insight and no action.
Review Patterns With Customer Immersion, Not Dashboard Distance
The dashboard shows you the pattern. It doesn't show you the customer. Get your revenue leaders onto live calls and into transcripts at least once a quarter, so they hear the complaint in the customer's own words. A metric reviewed from a distance stays abstract. Reviewed next to the customer's voice, it becomes a decision. The leaders who do this well tend to be the ones who keep building their own learning agility, because the market and the customer keep changing the answer.
Measure What Your Customers Feel
A brand is a promise that creates an expectation around an experience. Customer experience KPIs are how you find out whether you're keeping it.
AI will keep making measurement faster and cheaper. The companies that improve customer experience year after year will be the ones whose leaders stay close enough to the customer to know what the numbers mean. That's the edge that compounds: loyalty that turns into renewals, renewals that turn into advocacy, and a reputation your competitors can't copy.
Measurement tells you where the experience is breaking down. Fixing it takes people who know what to do with what the numbers reveal, and that's the work at the heart of my customer experience keynote, The Art of Standing Out. If you're planning your next leadership meeting or sales kickoff, let's talk.